Welcome to a new season of data! And wow is it already looking quite different than our previous seasons as a club. A revolutionary new technical staff will do that for a team. So that is what this first article of the year will be, as I take an in-depth look at the numbers 5 games in to see how the change in style is reflected in the data. (Note that these data will not include the recent Richmond game, as this was all calculated before that game). Let’s dive on in!
We have been Non-Stop
Dom’s style is indeed quite different than Jay’s. Let’s first take a look visually:
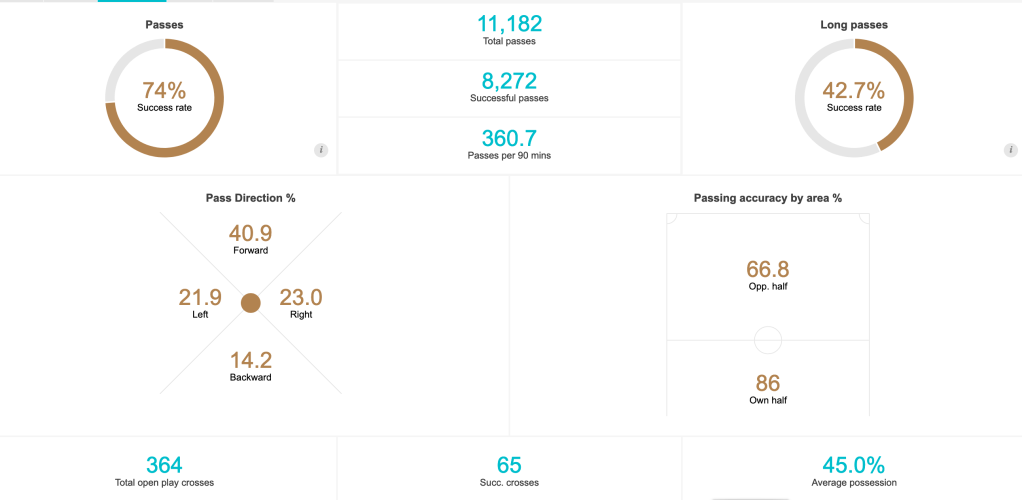
That’s what last year looked like. Pretty common to what we’ve seen before: Lower passing and possession, hit opponents on the counter, a lot of playing the ball forward to our strikers/high midfielders and wingbacks.
Now, here is what this season currently looks like:
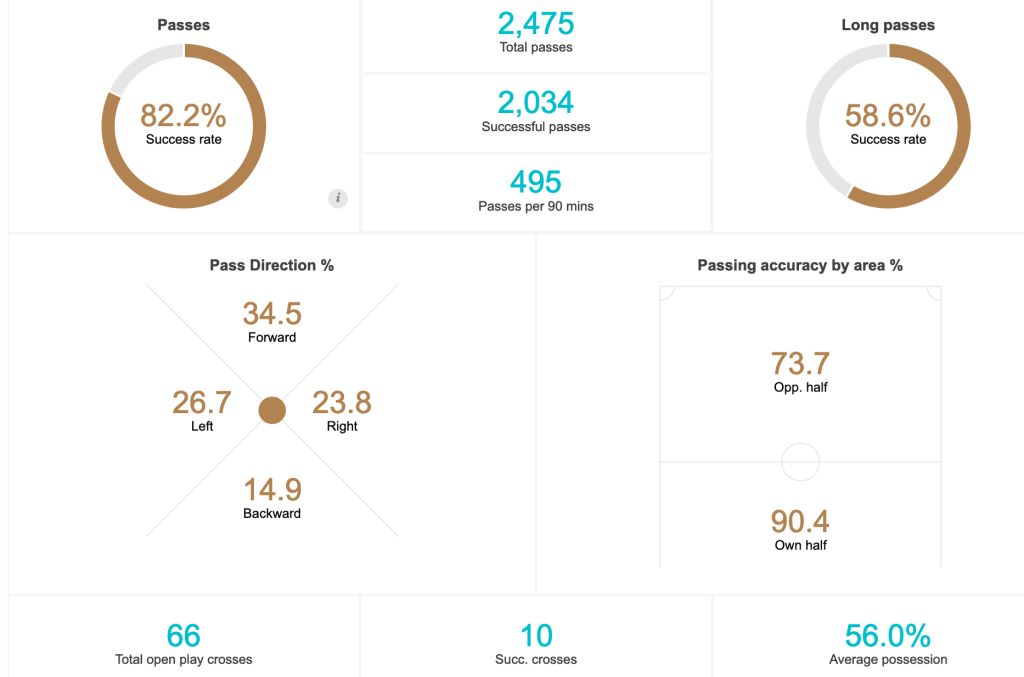
A massive change! 82.2% passing rate? 495 passes per game? 56% possession? We just keep going and going, controlling the ball and moving it around. It definitely makes for what people might call “more entertaining” soccer. Let’s take these different stats one at a time and compare this season to last season to see how that is happening.
First, the possession stat; 56% possession puts us at 2nd in the league behind only One Knox. Remember that 45% from last season? That had us in *last*. Essentially flipping from one side to the other, which we will see quite a bit throughout the data.
Well with all that possession comes a lot more passing. Enough that through 5 games we’ve already made almost 1/4th the number of passes from last year in total! That puts us on track to blow by the previous season’s final number around the 2/3rds mark of the year. In another example of a complete flip, we had 266.8 successful passes per game out of 360.7 total passes per game last season, which was the lowest in the league. This season we are sitting at 406.8 successful out of 495 total passes per game, the highest totals in the league by a decent margin. No one else is at even 450 passes per game and Chattanooga is the only team with a higher passing percentage, 83% compared to our 82.2%. In fact (before last Wednesday night’s games), we had more passes than every team who had played a game more than us!
Need to Make Sure We Don’t Blow Us All Away
Another set of data that isn’t shown in the above graphic that I want to look at more is the set of stats labelled “Discipline”. This includes fouls for and against as well as cards. Last year we ranked 10th, second to last, in both yellows and fouls. We had 69 yellow cards for 2.23 yellows per game and 391 fouls conceded for 14.8 fouls per game. Let’s keep those numbers in mind as we look at this season.
We currently sit at 3.4 yellows per game (2nd) and 15.4 fouls per game (3rd). A big turnaround here as well! The most likely reason with the increase in fouls overall is at least in my guess due to us being the ones getting counter-attacked now that we hold the ball more, so we foul a little more to stop those counter attacks. That is something I may look more into for future articles. We can at least take some solace in not being first spot in either, which in both cases goes to newcomer One Knoxville.
Not Afraid to Take My Shot
Lastly I’m going to look at our offensive/defensive comparisons a little in respect to prior seasons. This is a bit harder to quantify right away, as goals are a bit harder to come by than a normal style of play.
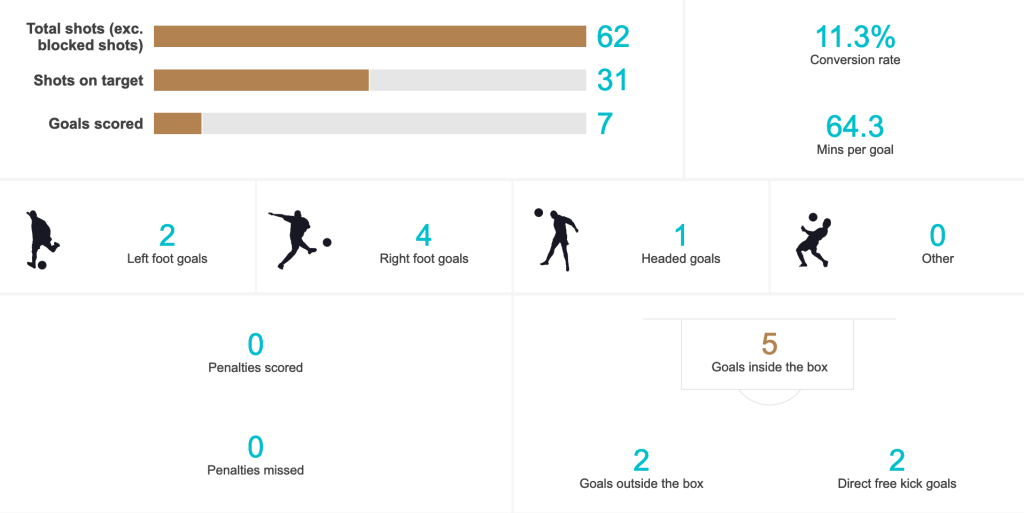
The first thing to note here are our total shots and shots on target. Those end up being 12.4 shots per game and 6.2 shots on target per game. Those numbers are higher than any other season, with 2020 being the top shots per game mark at 11.63 and 2021 having the highest shots on target per game with 4.8. So we are VERY willing to shoot.
Unfortunately as you can also see, that means that we aren’t scoring all that much. We’ve only scored 7 goals in the first 5 games, giving that 11.3% conversion rate and 1.4 goals per game. And that is where we haven’t seen as much success yet. 11.3% conversion rate is second worse we’ve had (2021: 17.2%, 2022: 11.6%, 2023, 2020: 10.8%). The goals per game and minutes per goal is better, only behind 2021, but it seems like we haven’t quite found a way to convert more of our plentiful shots to goals just yet.
Another thing I do want to note is our free kick goals. We have 2 already this year, which matches our all-time total from prior seasons. That’s right! We only had 1 in 2021 and 1 in 2022 and have already had 2 this year. Definitely something to keep an eye on as the season continues.
The last note I wanted to make was on the defense, as being more attacking minded has led to us tending to leave ourselves more open to counters. There’s definitely evidence showing up some, but this is another area where I think we’ll have to wait to see more data. Currently we’ve allowed more goals per game than every season but last year, which we are just 0.1 ahead of at the moment.
So that’s the first look into the data of the new system under Dom and the new technical staff. I am SO curious to see how it will play out the rest of the year and hopefully see those increased chances convert to increase goals. Viva Búhos!
