IT HAPPENED! It all came together for Los Buhos on Saturday night and it was as satisfying as you could hope for, and then some. The result itself would have been immensely satisfying but was improved by results from around the league. We need a few more weeks just like this one and we’ll see where we are on the 24th. But enough with the niceties, let’s dive in.
1) Who keeps the shots out?
It seemed to me that Rashid Nuhu had a lot to do on Saturday night. Let’s see if that is right?
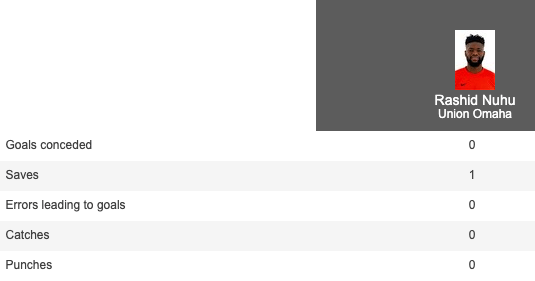
Wait, WHAT?! That was my reaction to this, so I dug a little deeper and turns out that what I was seeing was Rashid making “recoveries” where he “wins back the ball when it has gone loose or where the ball has been played directly to him.” And he had a lot of them.
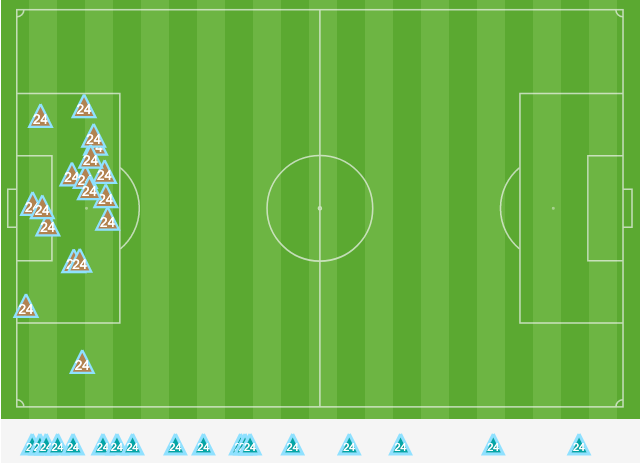
In particular, the recoveries did seem to be concentrated in the first half. Look at the same stat versus FtLCF.
So Rashid was really working harder than he was midweek. Did it have something to do with our possession?
2) Possession and results.
I’ll freely admit I’m not the most sophisticated watcher of soccer. It’s part of the reason I spend a lot of time looking at stats trying to gain a better understand of what I just watched. But I was STUNNED to learn we only had 38% of the possession in this game. Which made me wonder: do we do better the less we have the ball?
| Game Number | UO Possession | Result | Points Earned |
| Game 1: | 43.8% | Draw | 1 |
| Game 2: | 38.2% | Win | 3 |
| Game 3: | 44.2% | Win | 3 |
| Game 4: | 64.2% | Draw | 1 |
| Game 5: | 43.2% | Draw | 1 |
| Game 6: | 42.4% | Win | 3 |
| Game 7: | 48.3% | Win | 3 |
| Game 8: | 51.9% | Draw | 1 |
| Game 9: | 45.4% | Loss | 0 |
| Game 10: | 55.0% | Loss | 0 |
| Game 11: | 59.5% | Loss | 0 |
| Game 12: | 29.6% | Win | 3 |
| Game 13: | 38.0% | Win | 3 |
It kind of looks like we do better when we posses the ball less. Let’s look at average possession by results.
| Win: | 40.1% |
| Draw: | 50.8% |
| Loss: | 53.3% |
That seems pretty significant, but can we come up with a definitive chart here?
| UO Possession | Points | Points per game |
| Under 50%: | 20 | 2.22 |
| Over 50%: | 2 | 0.5 |
Oh yeah, that’s a definitive chart. We’ve played 13 games and earned 22 points. In the 9 games where we’ve have less than 50% of the possession, we earned 20 points and lost once. In the 4 games where we’ve had more than 50% of the possession, we’ve earned two points through two draws and two losses. (Note this would be even MORE extreme if you used 52% as the cut off, but I feel this is saying enough while being balanced.) So, we still haven’t figured out how to win AND dominate possession.
Quick Toby Check:
Still looking great.
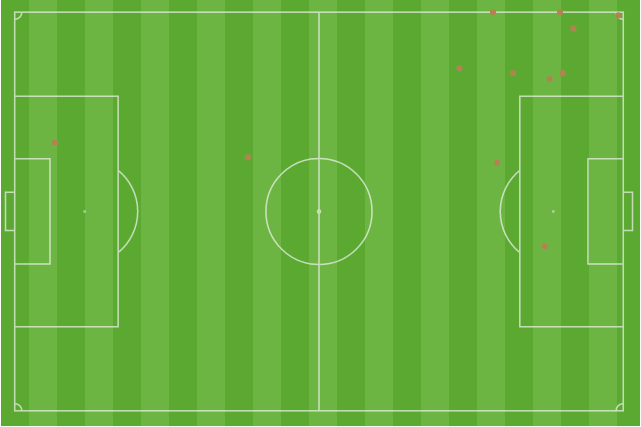
3) What about Dami?
Welcome back Dami! I’ve spent a lot of time talking about regressing to the mean lately. Dami definitely reverted to the mean in the first 12 minutes he was on the pitch on Saturday. Dami is currently sixth in League One for Chances Created tied with the only other defender in the top 10 in that category, Elivelton. Dami has created his 19 chances in 215 less minutes on the pitch than the FC Tucson defender. Also until he came on as our left midfielder in the 72′ he had nothing but a handful of well deserved Team of the Week appearances to show for his efforts. So to watch him get a goal AND an assist was joyous and long overdue. Here is to seeing more of that in the future
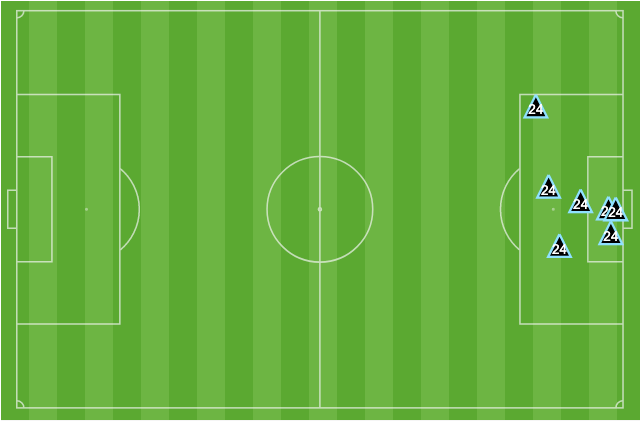
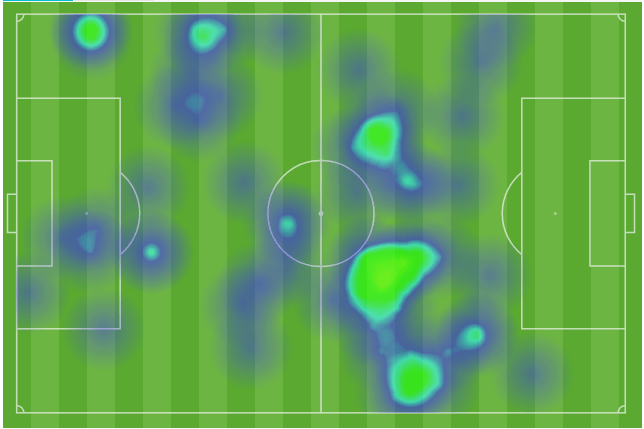
So check out just how far forward Dami was playing in this touch map.
And to close out this week’s column, just rewatch the highlights and enjoy every second.
